> ## Documentation Index
> Fetch the complete documentation index at: https://docs.ravan.ai/llms.txt
> Use this file to discover all available pages before exploring further.
# All Call History
> Monitor, filter, and review every conversation handled by your Agni agents—including transcripts, recordings, summaries, credit usage, and sentiment analysis.
The **All Call History** page serves as your centralized ledger for all voice interactions across your organization. Whether you are running high-volume outbound campaigns, fielding inbound customer support calls, or testing your web widget, every session is logged here in real time.
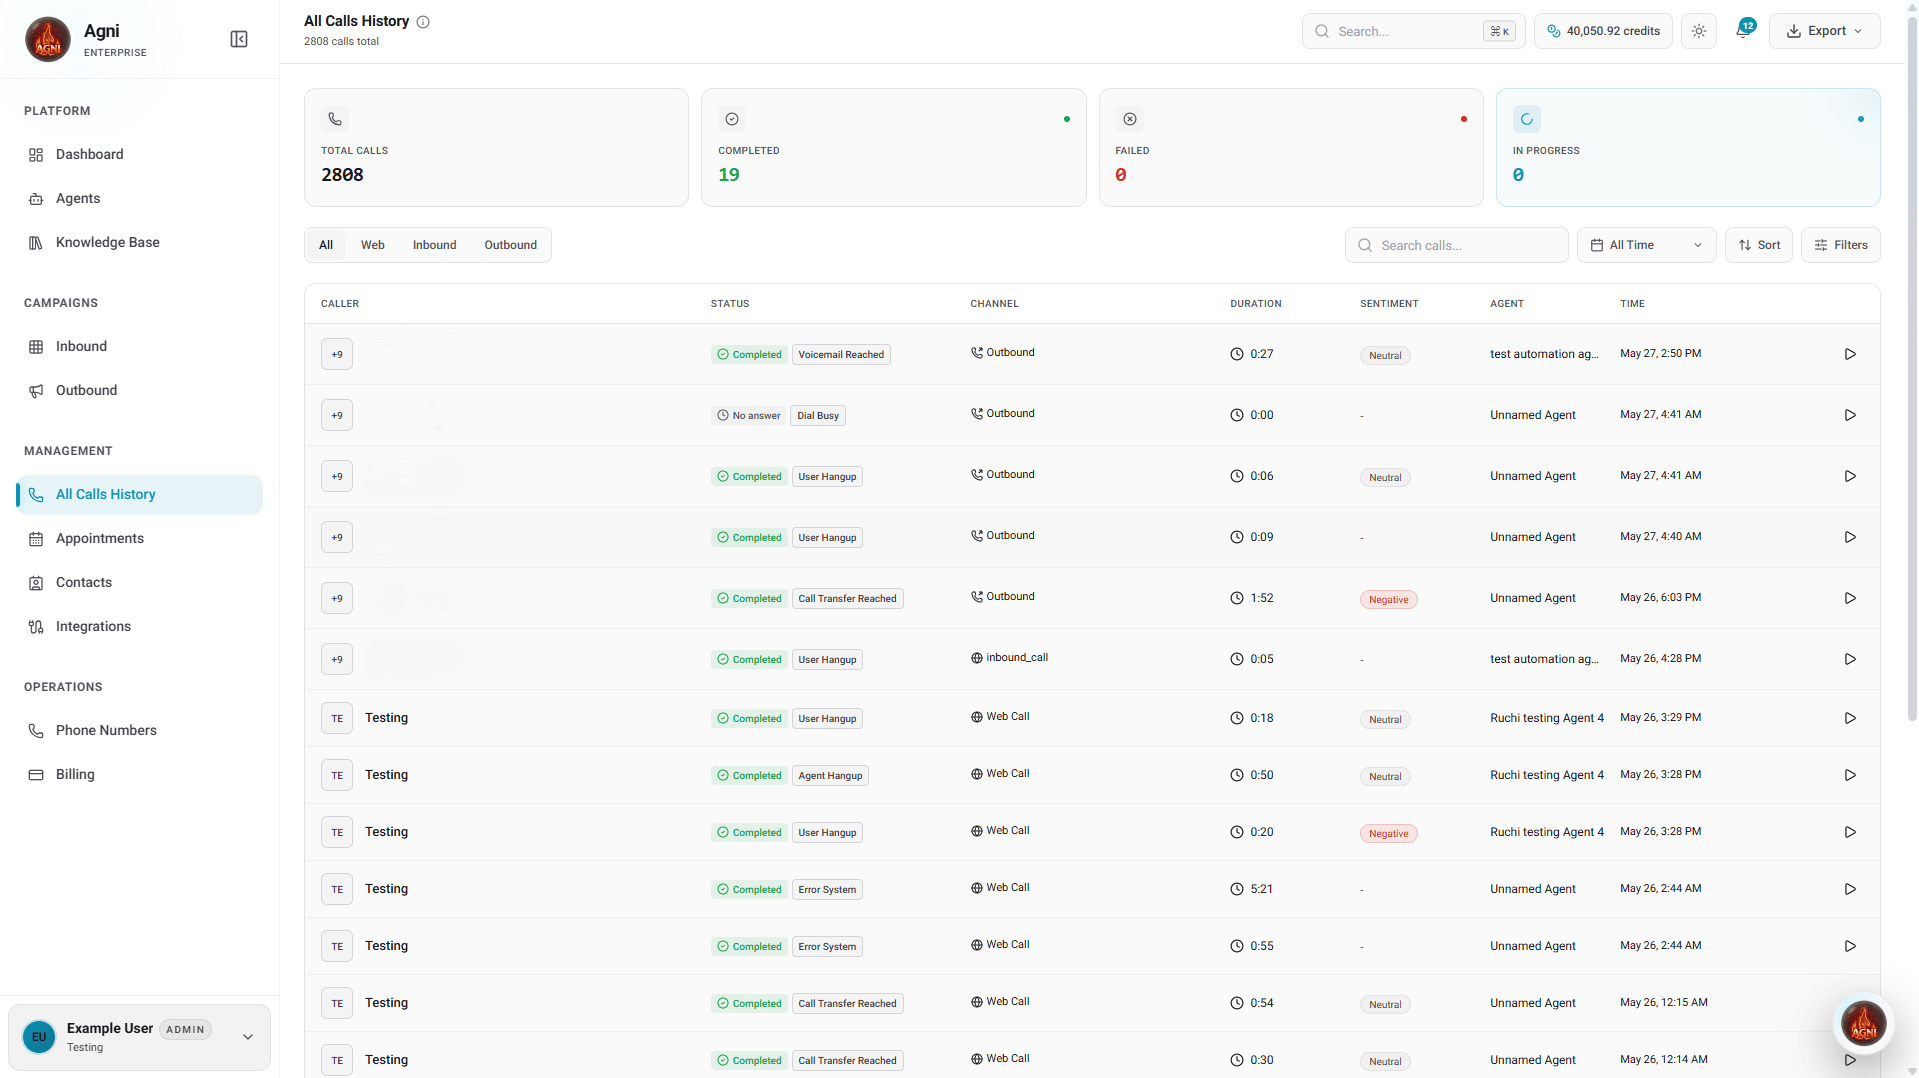 ***
## Session metrics
At the top of the dashboard, a quick-glance summary provides the status of your call volume for the selected timeframe:
The cumulative number of all calls across all channels and agents.
Calls that successfully reached their natural conclusion.
Calls that dropped, failed to connect, or encountered system errors.
Live calls currently being handled by your agents.
***
## Call data and channels
Agni consolidates traffic from multiple channels into a single view. You can filter the main table using the quick tabs above the list: **All**, **Web**, **Inbound**, or **Outbound**.
For every session, the table captures granular data:
* **Caller:** The phone number or web session identifier of the user.
* **Status:** The outcome of the call.
* **Channel:** The origin of the call.
* **Duration:** The total length of the conversation.
* **Sentiment:** The overall mood of the interaction.
* **Agent:** The specific AI agent that handled the interaction.
* **Time:** The date and timestamp of when the call occurred.
***
## Call detail view
Click on any row to open the full **Call Detail View**. This view provides a comprehensive breakdown of the conversation. The page displays metadata on the left and the interaction transcript on the right.
***
## Session metrics
At the top of the dashboard, a quick-glance summary provides the status of your call volume for the selected timeframe:
The cumulative number of all calls across all channels and agents.
Calls that successfully reached their natural conclusion.
Calls that dropped, failed to connect, or encountered system errors.
Live calls currently being handled by your agents.
***
## Call data and channels
Agni consolidates traffic from multiple channels into a single view. You can filter the main table using the quick tabs above the list: **All**, **Web**, **Inbound**, or **Outbound**.
For every session, the table captures granular data:
* **Caller:** The phone number or web session identifier of the user.
* **Status:** The outcome of the call.
* **Channel:** The origin of the call.
* **Duration:** The total length of the conversation.
* **Sentiment:** The overall mood of the interaction.
* **Agent:** The specific AI agent that handled the interaction.
* **Time:** The date and timestamp of when the call occurred.
***
## Call detail view
Click on any row to open the full **Call Detail View**. This view provides a comprehensive breakdown of the conversation. The page displays metadata on the left and the interaction transcript on the right.
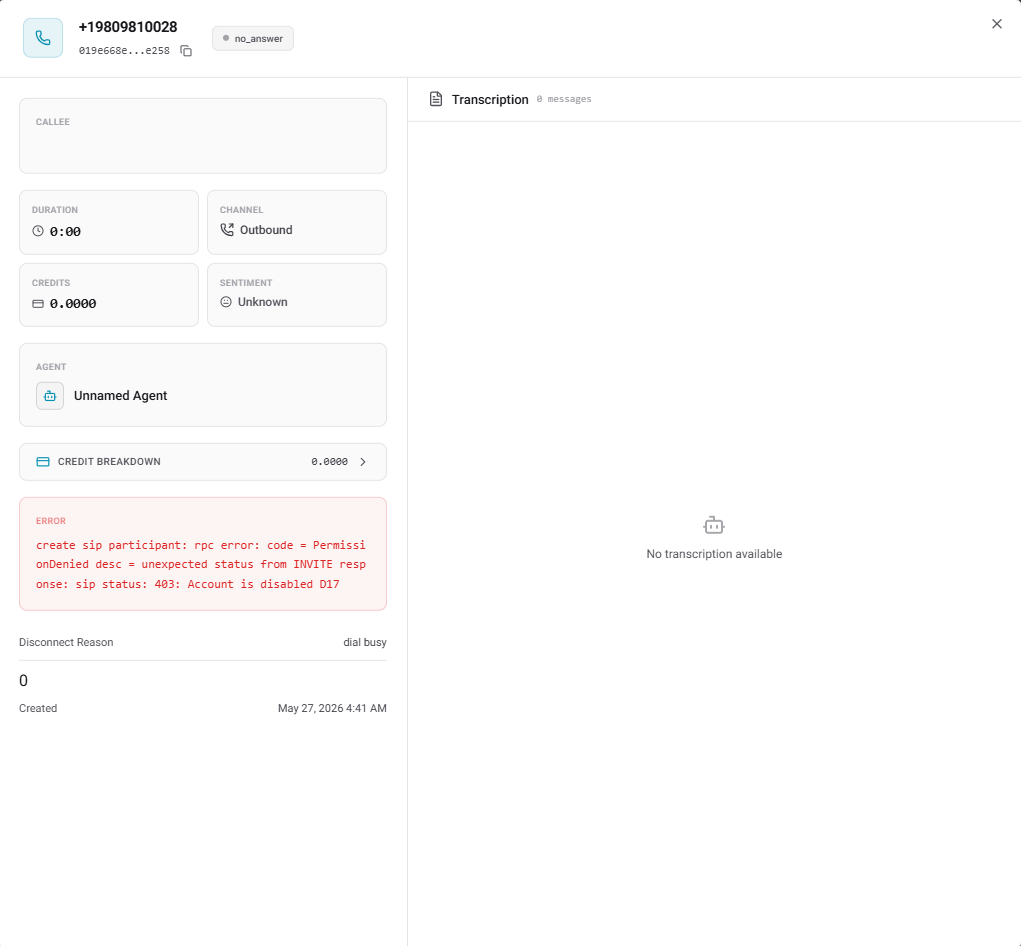
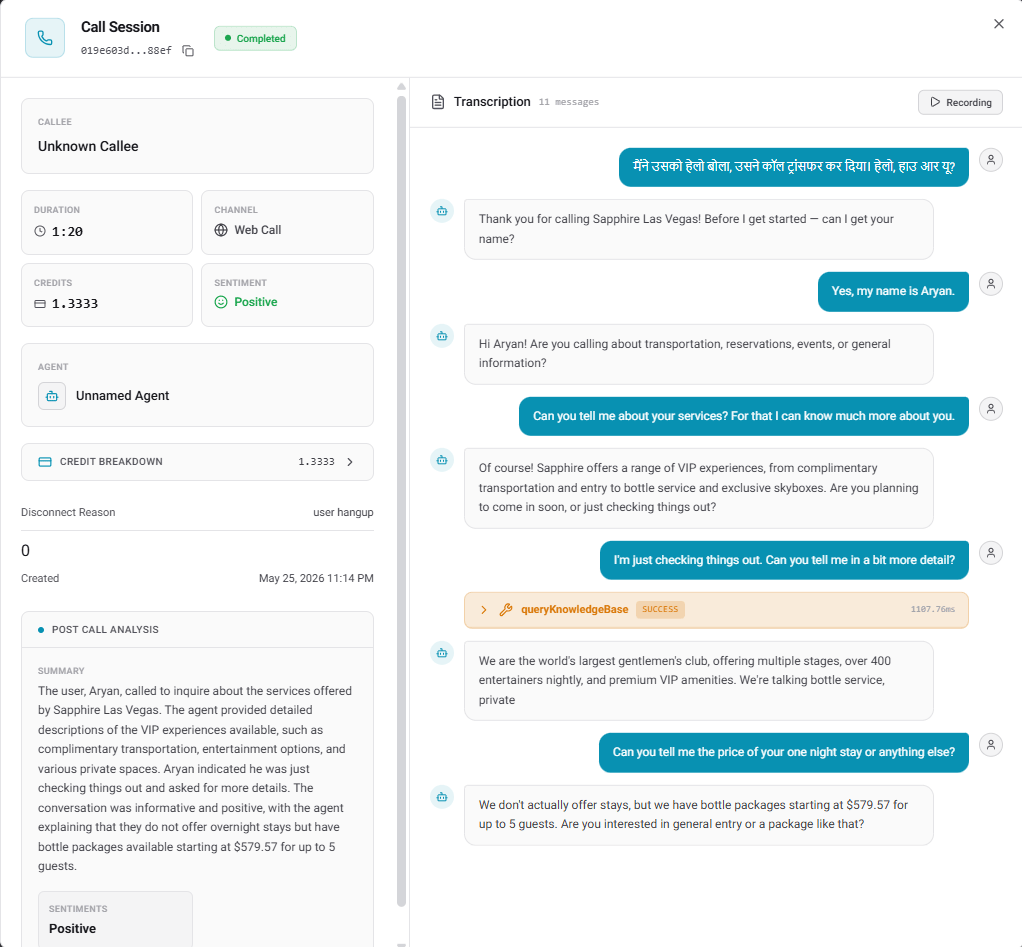 ### Left panel: Metadata and analysis
The left side of the detailed view gives you the technical and analytical breakdown of the call:
* **Core Metrics:** Instantly view the **Callee** number, total **Duration**, **Channel**, total **Credits** consumed, the overall **Sentiment**, and the **Agent** used.
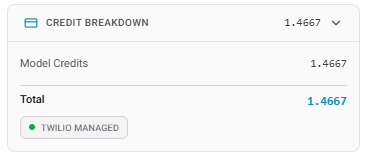
* **Credit Breakdown:** Click the dropdown arrow next to your total credits to see exactly how your balance was consumed. This splits the cost into **Model Credits** (Agni AI compute), **Twilio Credits** (telephony infrastructure), and **Other Credits**.
### Left panel: Metadata and analysis
The left side of the detailed view gives you the technical and analytical breakdown of the call:
* **Core Metrics:** Instantly view the **Callee** number, total **Duration**, **Channel**, total **Credits** consumed, the overall **Sentiment**, and the **Agent** used.
* **Credit Breakdown:** Click the dropdown arrow next to your total credits to see exactly how your balance was consumed. This splits the cost into **Model Credits** (Agni AI compute), **Twilio Credits** (telephony infrastructure), and **Other Credits**.
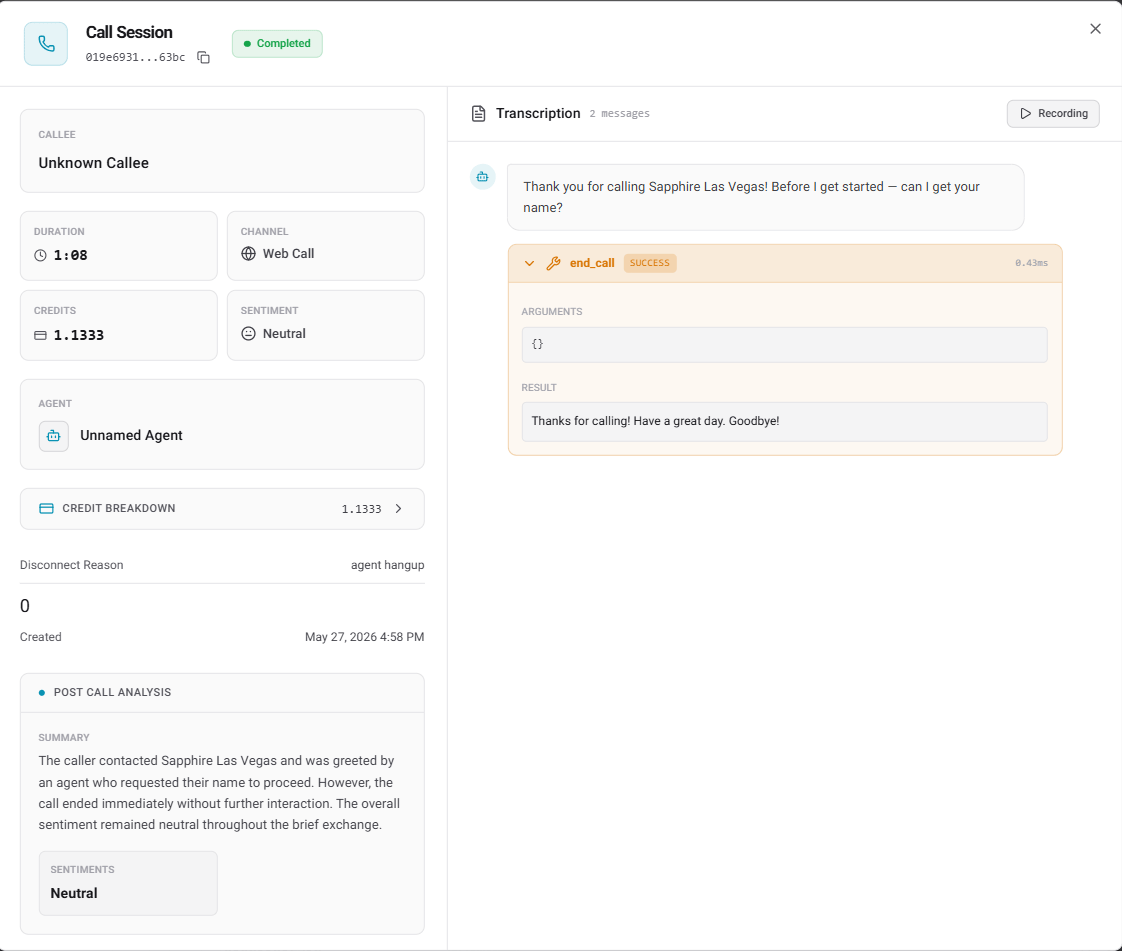
 * **Disconnect Reason:** Explains exactly why the call ended (for example, `user hangup` or `max duration reached`).
* **Created:** The exact timestamp the call was initiated.
* **Post Call Analysis:** If configured on your agent, this section displays the AI-generated **Summary** of the conversation along with the final evaluated **Sentiment**.
### Right panel: Transcription and recording
The right side of the view is dedicated to the actual conversation flow:
* **Transcription:** A timestamped, speaker-labeled transcript presented in a chat-bubble format. The AI agent's responses are on the left, and the user's responses are on the right.
* **Recording:** Click the **Recording** button at the top right of the transcription panel to listen to the actual audio of the phone call.
* **Tool Calls:** View active tool invocations inline within the transcription flow. Click any tool card (such as `calcomAppointment`) to expand it. This reveals the full request payload and the response data for troubleshooting.
* **Disconnect Reason:** Explains exactly why the call ended (for example, `user hangup` or `max duration reached`).
* **Created:** The exact timestamp the call was initiated.
* **Post Call Analysis:** If configured on your agent, this section displays the AI-generated **Summary** of the conversation along with the final evaluated **Sentiment**.
### Right panel: Transcription and recording
The right side of the view is dedicated to the actual conversation flow:
* **Transcription:** A timestamped, speaker-labeled transcript presented in a chat-bubble format. The AI agent's responses are on the left, and the user's responses are on the right.
* **Recording:** Click the **Recording** button at the top right of the transcription panel to listen to the actual audio of the phone call.
* **Tool Calls:** View active tool invocations inline within the transcription flow. Click any tool card (such as `calcomAppointment`) to expand it. This reveals the full request payload and the response data for troubleshooting.
 * **Error Logs:** View detailed error logs directly when a call fails or goes unanswered. This includes carrier errors from telephony providers like Twilio or errors during the call.
 ***
## Search, filter, and export
To manage large volumes of call data, utilize the toolbar located above the main table:
Look up specific calls by phone number or session ID using the search bar.
Narrow down your view by selecting specific timeframes or applying advanced filters.
Click the **Export** button in the top right to download your currently filtered call logs as a CSV file.
***
## Search, filter, and export
To manage large volumes of call data, utilize the toolbar located above the main table:
Look up specific calls by phone number or session ID using the search bar.
Narrow down your view by selecting specific timeframes or applying advanced filters.
Click the **Export** button in the top right to download your currently filtered call logs as a CSV file.