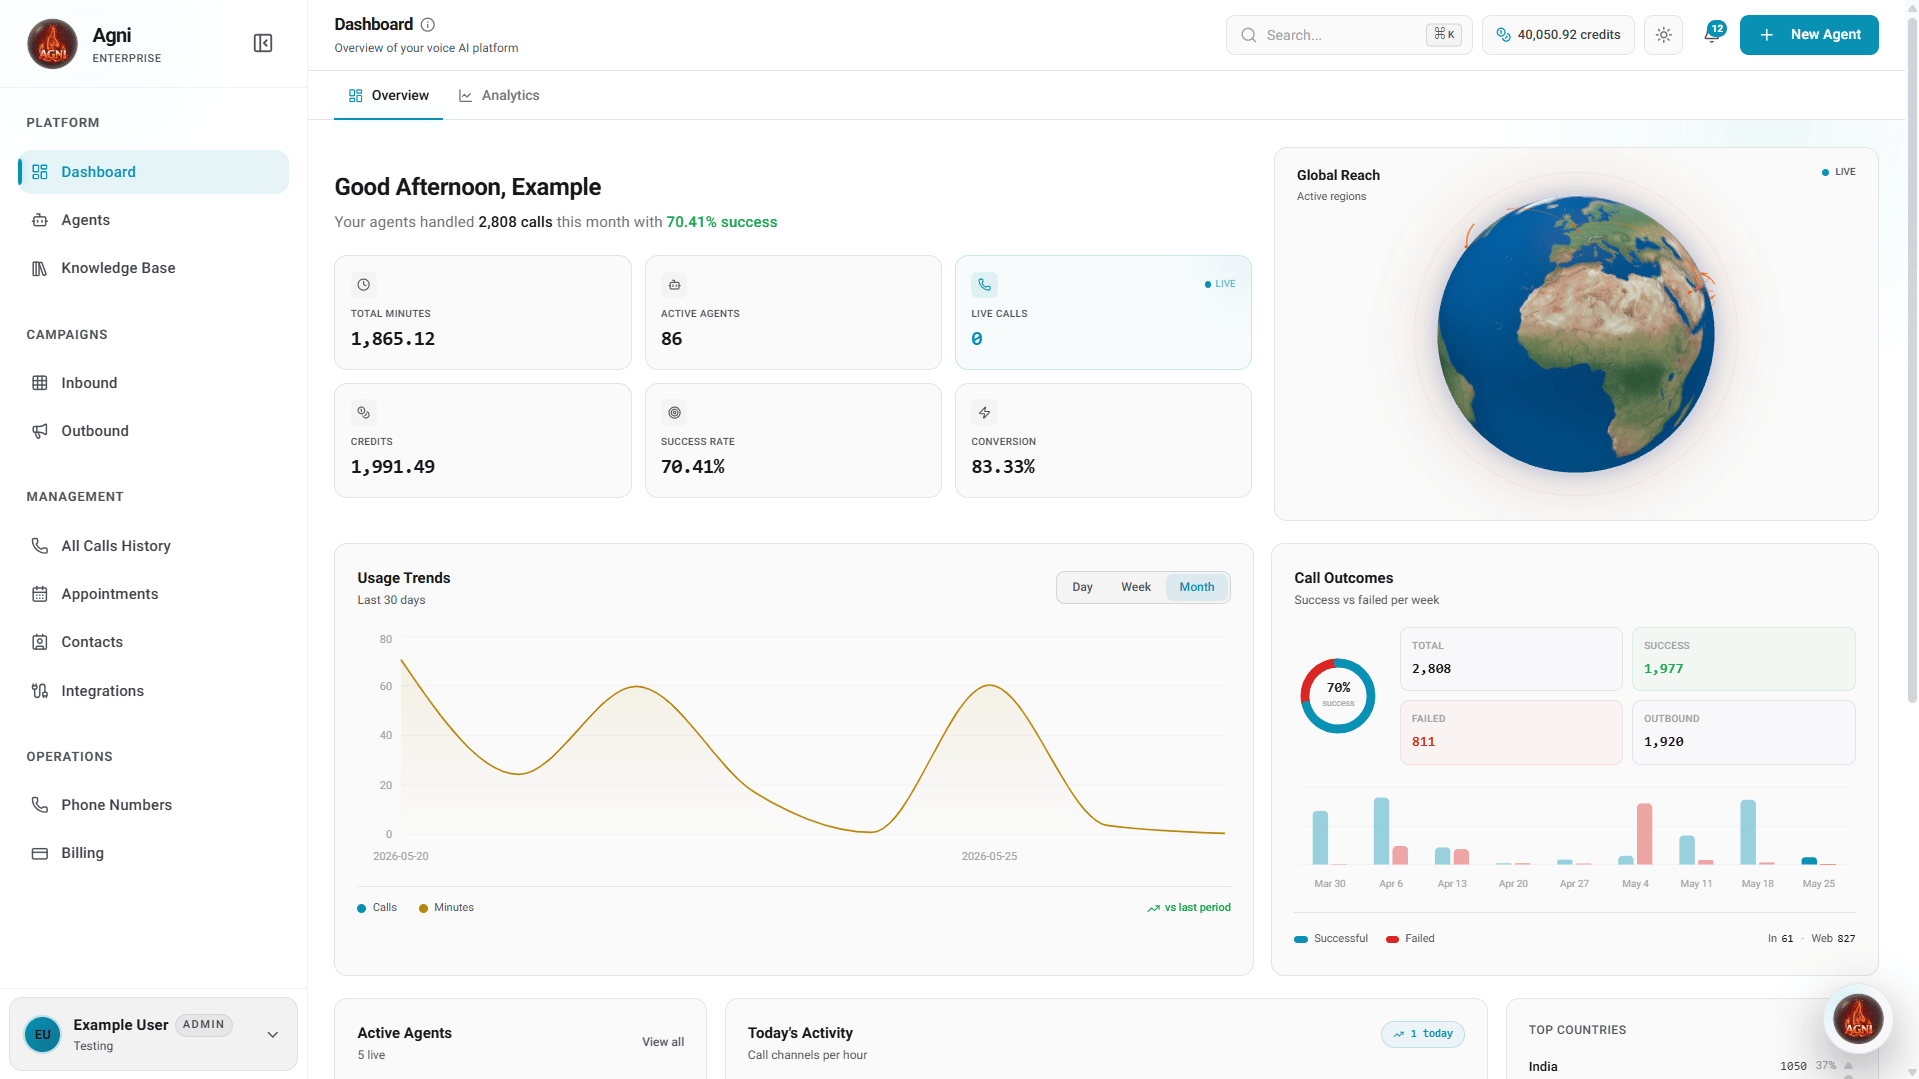
At-a-Glance Metrics
At the top of your dashboard, you can quickly assess the high-level health and performance of your voice agents in real time:Total Minutes
Displays the aggregate conversational minutes consumed by your organization.
Active Agents
Displays the total number of AI agents currently active within your organization.
Live Calls
Shows the number of real-time, concurrent calls currently happening through your organization.
Credits
Shows the total amount of credits burned or consumed by your organization to date.
Success Rate
Highlights the overall percentage of calls made through the organization that successfully achieved their objective.
Conversion
Displays the total number of customers that have been successfully converted during interactions.
Live Visualizations & Analytics
The center of the dashboard provides a suite of interactive widgets to help you monitor system load and campaign outcomes dynamically.Global Reach
A live 3D visualization showing exactly where in the world your active calls are currently taking place. Useful for understanding your geographic distribution.
Usage Trends
Track how many calls and minutes have been spent over a specified period. Toggle between Day, Week, or Month views to spot patterns.
Call Outcomes
A detailed breakdown displaying the number of Total Outbound Calls, Total Failed Calls, Total Success Calls, and overall Total Calls.
Today's Activity
Shows the total call volume for the current day, categorized by outbound, inbound, and web calls.
Active Agents
A quick view of your currently active agents and the respective number of calls they have handled.
Top Countries
Highlights the countries that have received the most calls or where you have initiated the highest call volume.
Quick Actions
Located at the bottom of the dashboard, the Quick Actions panel provides one-click access to your most common operational workflows:Create Agent
Build a new AI assistant.
New Campaign
Launch outbound calls.
Add Contact
Import or create users.
Add Number
Provision a phone number.
Workspace Navigation
The left sidebar is your primary map for navigating your Agni workspace. It is divided into focused sections:Platform
Platform
Your daily operational views and agent configurations.
- Dashboard: Your high-level overview and metrics.
- Agents: Create, update, and deploy your AI agents.
- Knowledge Base: Manage the data and documents your agents use for context.
Builder
Builder
Build and tune agent behavior.
- Tools: Configure functions, actions, and integrations used by agents.
- Prompt Engineering: Design prompts, guardrails, and response behavior.
Campaign
Campaign
Configure inbound and outbound calling workflows.
- Inbound Calls: Configure routing for incoming traffic.
- Outbound: Manage and monitor outbound calling workflows.
Management
Management
Detailed tracking and relationship management.
- All Call History: Review detailed call logs, transcripts, and session data.
- Appointments: Manage booked calendar events and scheduling.
- Contacts: Manage your CRM and address book.
- Integration: Connect third-party systems and data flows.
Operation
Operation
The backend infrastructure of your workspace.
- Phone Numbers: Buy, import, and release phone numbers.
- Billing: Manage your subscription, credits, and invoices.